GenoMycAnalyzer
GenoMycAnalyzer is a web based service to analyze samples to identify Mycobacteria tuberculosis drug resistance and non-tuberculous Mycobacteria(NTM). With an automated pipeline, the user-uploaded paired end sequencing data is processed to provide the user with information on various aspects of the sample such as the predicted Mycobacterial species or the molecular drug susceptibility.
This guide consists of two parts: Getting Started for a quick guide, and a Vignette for a more detailed guide with an example. Use the ctrl-F function on this page for the explanation of the feature of interest.
Table of Contents
Getting started
In the GenoMycAnalyzer pipeline, various tools are arranged in a pipeline to analyze NGS data. For the information on the tools used and the theory behind the choice, refer to the About page. (Hyperlink to the ABOUT page)
Quick guide
-
Upload your data in the Data section by clicking the ADD button.
Warning: Do not refresh or close the page during the upload.
-
In the Analysis webpage, a new analysis job can be created by clicking the "ADD" button.
The data uploaded in step 1 can be selected. Note that additional metadata can be given in this step, such as the Patient ID and the Sample ID.
-
Additional analysis parameter can be changed using the ANALYSIS OPTIONS in the personal options. The options can be accessed by clicking on the account information in the upper right corner. Refer to the Vignette for a deeper explanation of each category.
-
Multiple jobs can be uploaded in a batch using the BATCH UPLOAD function. Refer to the Vignette for a deeper explanation of how this works.
-
-
After the job creation, the analysis job can be initiated by clicking on the START button either in the Analysis webpage or inside the summary page of the job.
The summary page of the job can be opened by clicking on the arrow in the detailed view column.
- The job status can be checked in the Status column in the Analysis list page or inside the Summary page of the job
- When the job is done, the analysis results can be accessed in the Summary page.
Interpretation of the result
GenoMycAnalyzer provides the user with various analyses of the sample. In this section, each criterion will be explained
Summary
In the summary page, five major blocks can be seen.
-
The Sample Info block summarizes the metadata given at job creation. Note that this information can be edited in this page.
-
The Analysis Report block lists all completed and the ongoing pipeline steps.
-
The Analysis Summary summarizes the major results of the analysis
-
The Circos plot contains the circos plot of the sample. Refer to this paper for the information about this plot.
-
The Molecular drug susceptibility testing block contains the information on drug resistence of the sample on the 15 drugs.
Statistics&QC
In the Statistics&QC page, the actual numbers of the mapping information is given in the Basic statistics block.
-
The QC block records the various QC steps and their status. If any of the QC measure fails, the QC pipeline identifies it as failed QC.
-
The Lineage & Spoligotype for M. tuberculosis block provides the user with information used for further subtyping of tuberculosis species.
-
In the Species prediction statistic block, the information on identified species in the sample is recorded.
Variants
In this section, all indel/mutation variants are recorded with information on their positions. The position of the variants can be visualized with the integrated IGV tool by clicking on the Position column
Large deletion
This section protocols all large deletions detected in the targeted four genes, (pncA, katG, gid and ethA). The deletion location can be visualized with the integrated IGV tool by clicking on the Position column.
RAV
The RAV stands for resistance associated variants, and it lists all variants that would induce drug resistance. Unlike the RAV section, this section provides the user with additional information on the amino acid change and its resistance target.
Report
In the Report tab, the summary of the analysis job is generated. This analysis includes all analyses in a single document. Additional comments can be added using the Comment Edit option, and the whole report can be downloaded in a pdf file using the PDF Download button.
Vignette
In this section, a small example case will be demonstrated as a showcase of interpreting the results.
Uploading the data
Download the prepared data demo_data_R1.fastq.gz and demo_data_R2.fastq.gz. These two files are used as toy data for the demonstration.
After downloading the data, upload them on the server in the Data section with the ADD option. Upon clicking the ADD button, the files can be selected and uploaded in the pop-up window. Note that multiple files can be selected simultaneously for the upload procedure, but all files are required to have fastq.gz suffix.
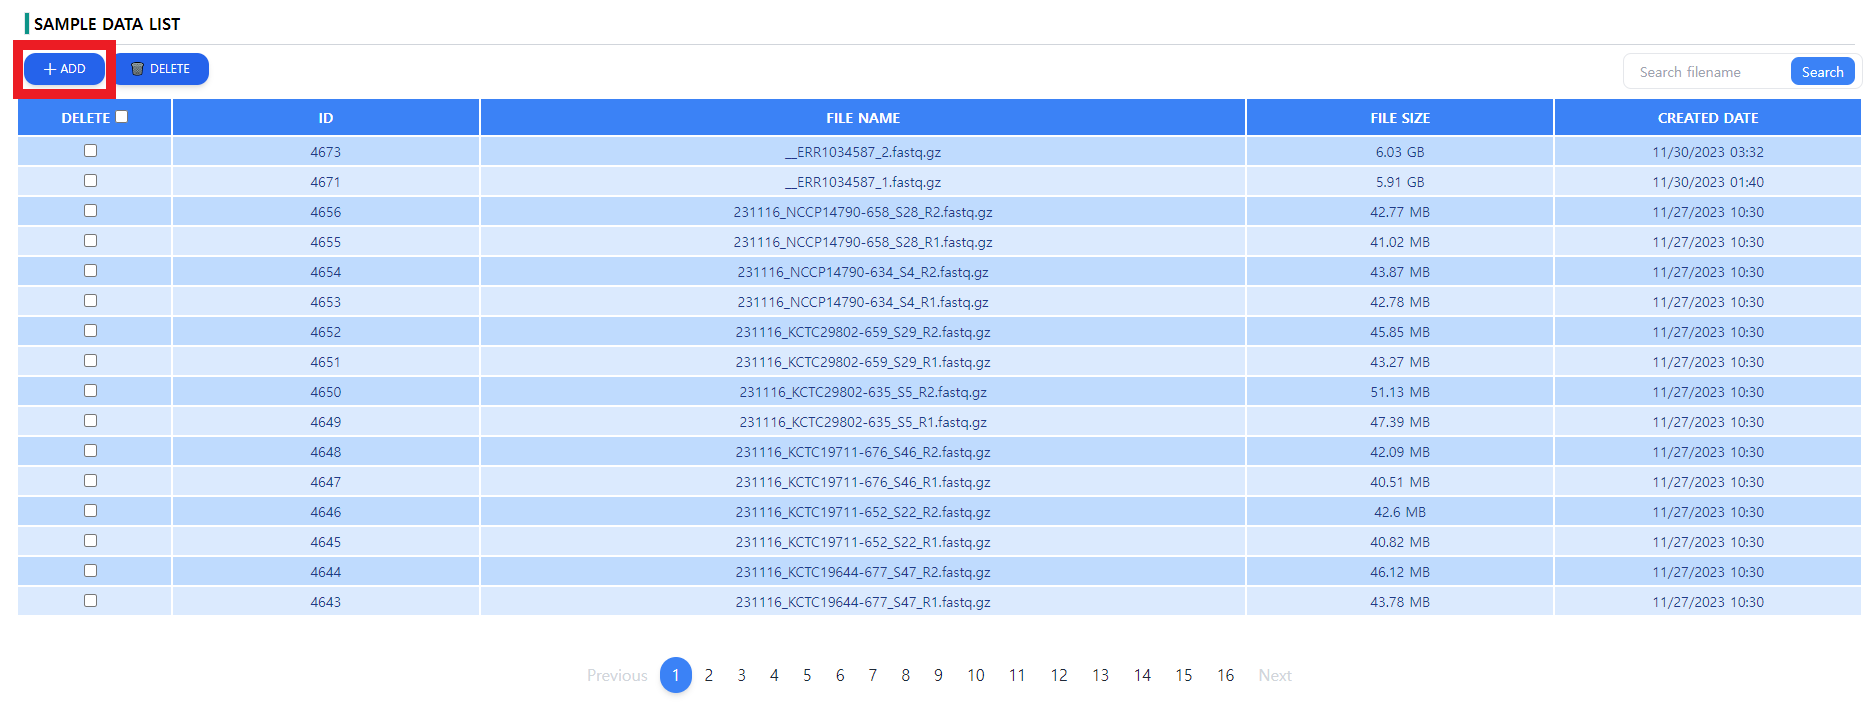
Figure 1: The data page. The downloaded files can be uploaded via the ADD button. The uploaded files can be deleted from the server using the DELETE button
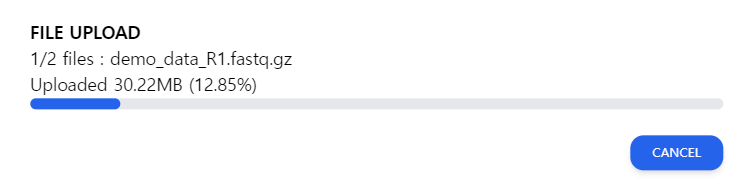
Figure 2: The upload screen. Do not close the window while the file is being uploaded.
As depicted in the Figure 1, the list of the uploaded data is displayed in a tabular format with additional file data such as the file size and the creation date. A general recommendation is to name the paired end data files os that the pairs can be clearly identified. Note that upon uploading unwanted data, the data can be deleted by using the DELETE button next to the ADD button.
It is important not to close the window during the uploading process. When the window is closed in the upload screen depicted in Figure 2, the file upload will be canceled. The user will have to re-upload the file.
Initializing an Analysis job
After uploading the data, the sample can be queued up for analysis. Again, using the ADD function highlighted with a red rectangle, a job can be initiated.
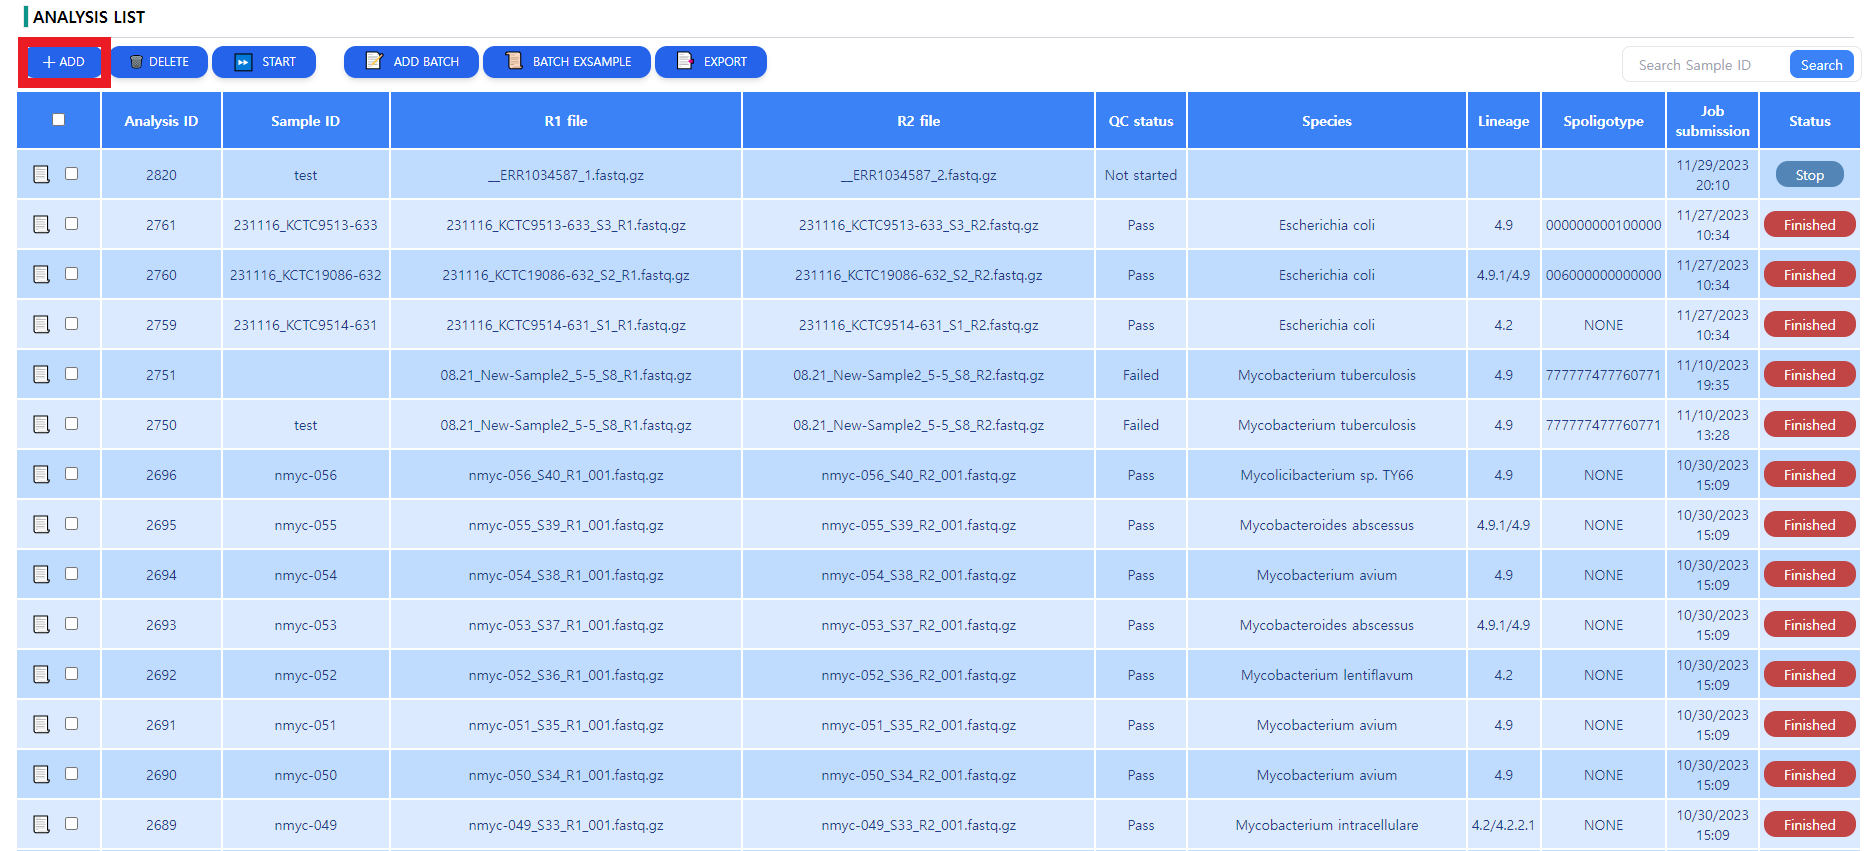
Figure 3: The analysis page. The downloaded files are queued up for analysis, some metadata can be read in a tabular format.
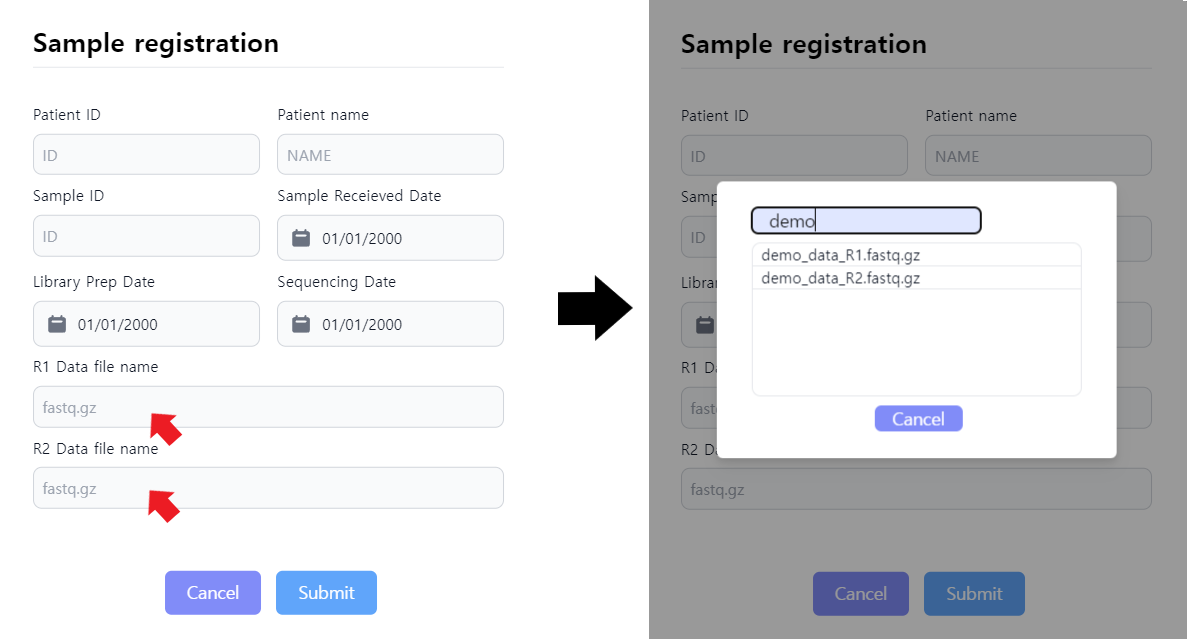
Figure 4: Sample registration to prepare for job initialization. Upon clicking the R1 and R2 data file names, the data uploaded from the first step can be selected.
After clicking on the ADD button depicted in Figure 3, the sample registration window pops up. The user can specify the metadata of the sample as depicted in Figure 4. The data selection is done by clicking in the data input area highlighted in Figure 4. After data selection and metadata input, press submit to save the job. The job is not yet started. When false metadata was given, the data can be edited by pressing the paper sign in the leftmost column.
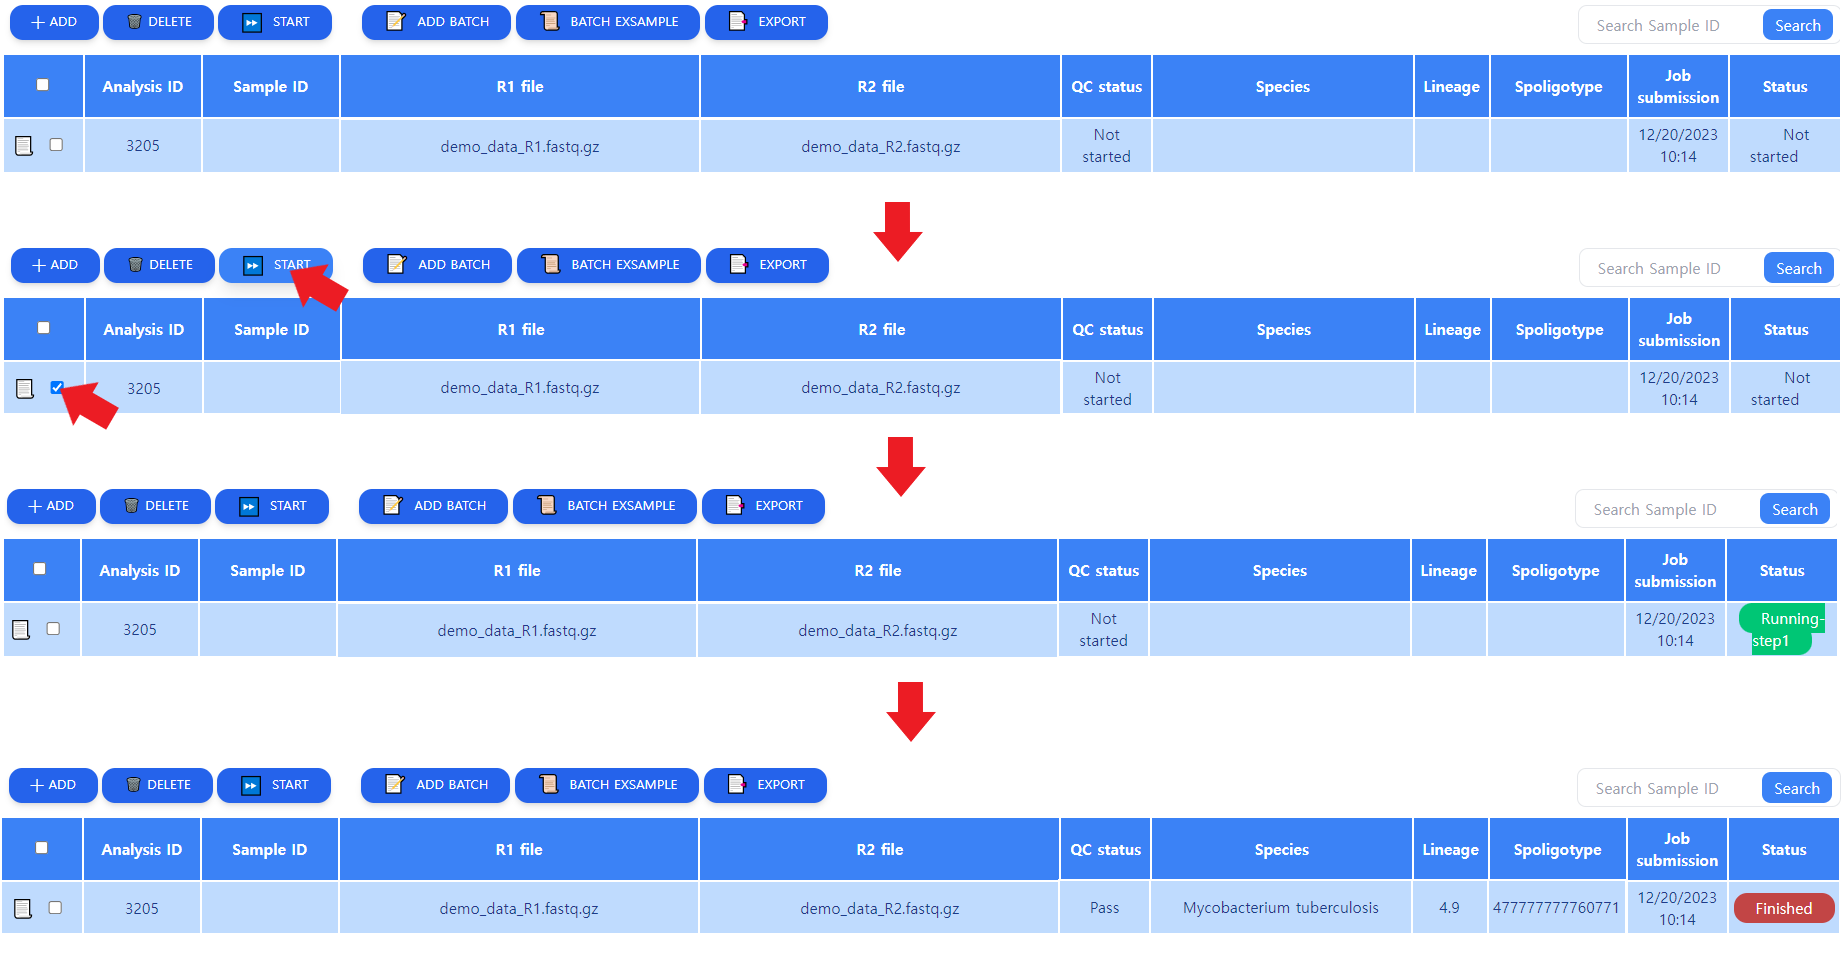
Figure 5: Job processing procedure. Upon clicking on the START button, the Status changes to "Running step n", and when done, to "Finished"
As depicted in Figure 5, the job does not yet start after submitting. The user must select the job by clicking on the box in the leftmost column and initiate analysis. The analysis will go through the processing steps automatically. When the analysis is done, the Status column changed into Finished. When the analysis is done, some results can be seen in the tabular view. These will be further explained in the next chapter.
Note that multiple jobs can be started simultaneously by clicking on the wanted jobs' leftmost boxes and pressing START.
Addition: Batch upload
In cases where there is a batch of samples, adding each sample individually for a job is not efficient. For such cases, the user can make an Excel file with the header as shown in Figure 6. Each column corresponds to the metadata column, which can be seen in Figure 4.

Figure 6: The Batch upload file. In this file, two samples, QA1 and QA2 will be added as batch to the server. In the analysis page, two separate jobs will be created.
Addition: Analysis options
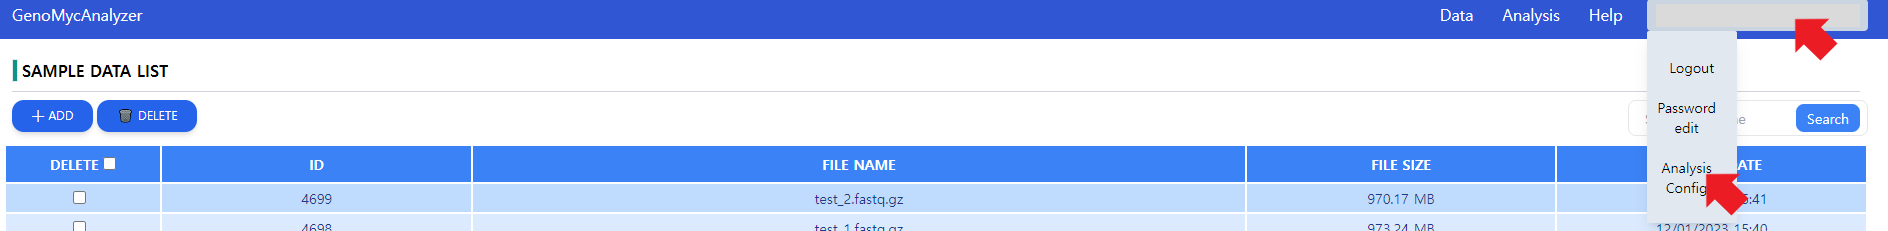
Figure 7: Getting to the analysis options. The user needs to click on the account information, then go on Analysis Config.
GenoMycAnalyzer service is an ensemble of multiple tools in a pipeline. For some tools in the pipeline, separate options can be set. As depicted in Figure 7, the option controls can be reached by hovering on the account information and navigating to Analysis Config option.
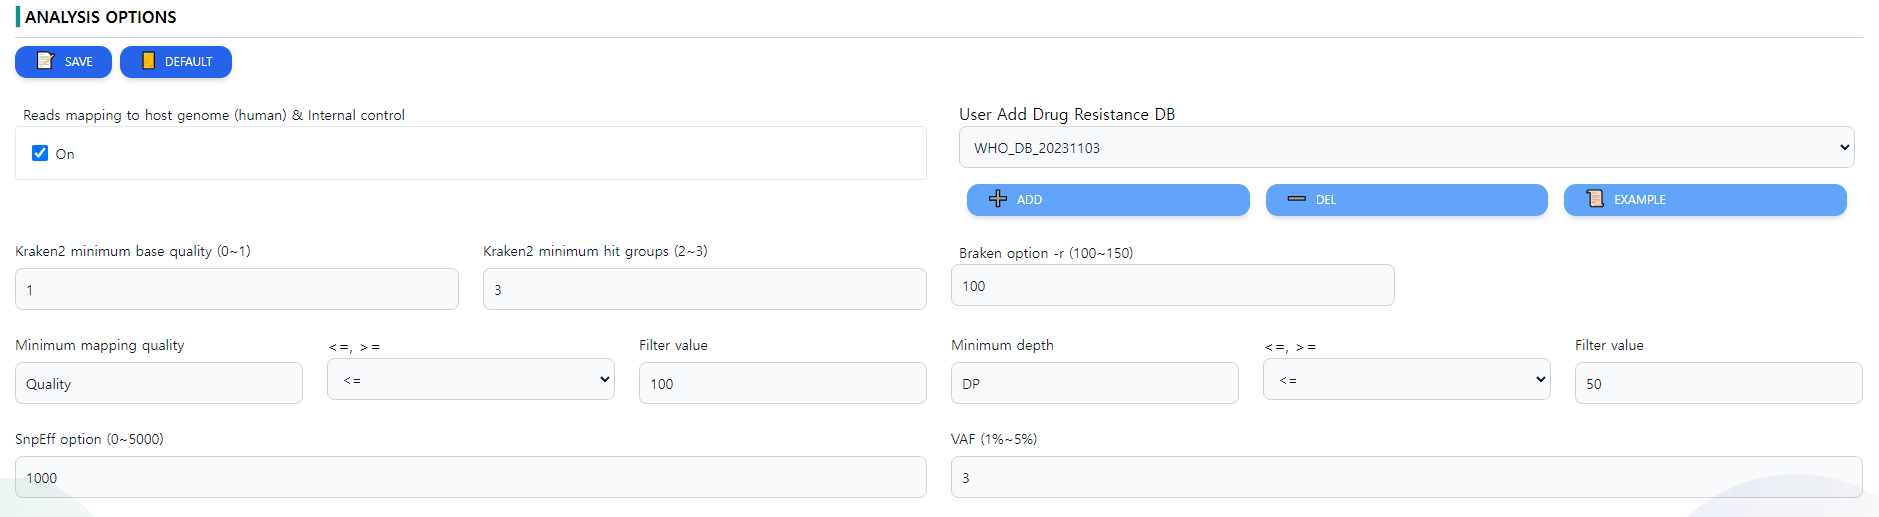
Figure 8: Analysis options. The options for individual tools can be set
In the analysis option page, there are multiple parameters. For users, it is generally advised to use the given parameters, but in specific cases, these options can be changed. A screenshot of the options page is depicted in Figure 8.
- Reads mapping to host genome (human) & Internal control decides whether the reads should be mapped against the human reference genome for better QC.
- Kraken2 minimum base quality changes the minimum base quality option of the algorithm Kraken.
- Kraken2 minimum hit groups This option will allow you to require multiple hit groups (a group of overlapping k-mers that share a common minimizer that is found in the hash table) be found before declaring a sequence classified, which can be especially useful with custom databases when testing to see if sequences either do or do not belong to a particular genome.
- Braken option -r This option allows the user to change the -r option of Braken
- Minimum mapping quality is the QC option to require a certain level of mapping quality to consider a read fit enough for the analysis.
- Minimum depth is the minimum depth per position on a mapping read required for the depth.
- SnpEff option (0~5000) This option changes the SnpEff parameters. Note that the values have to be between 0 and 50000.
- VAF (1%~5%) This option changes the VAF values. Note that the values have te be between 1 and 5.
The options can be saved using the SAVE button or reverted to defaults by the DEFAULT option in the top left side of the screen.
Interpretation of the result
Summary
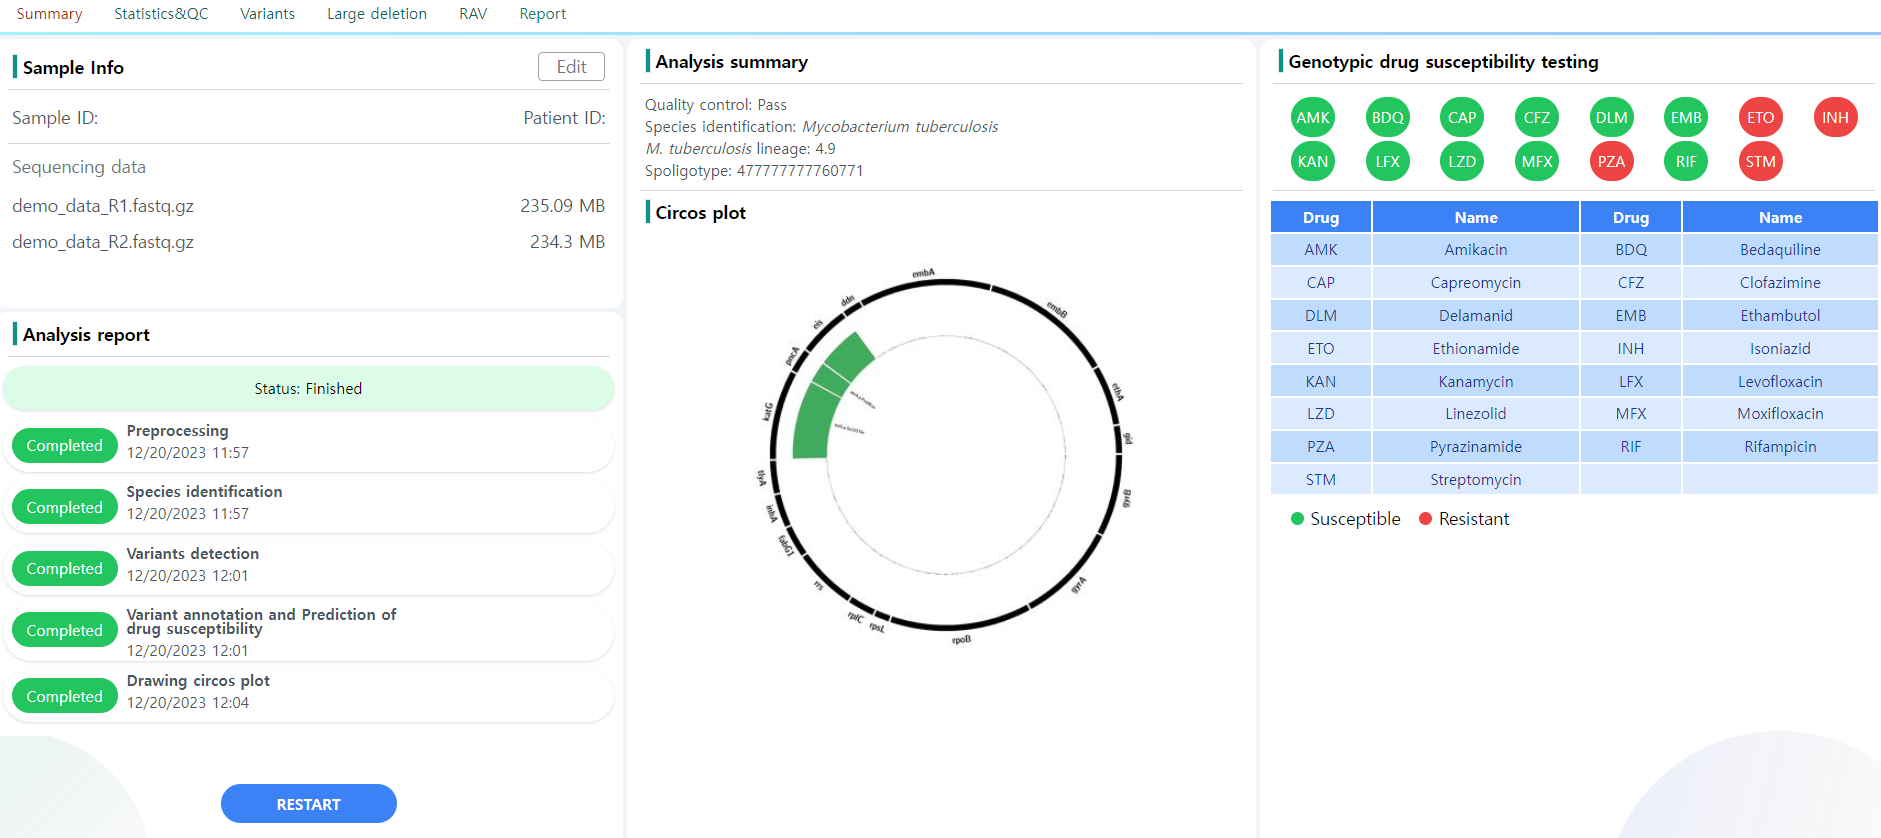
Figure 9: Summary page.
Upon clicking a finished job of choice in the tabular view in the Analysis page, the user gets redirected to the summary page.
There are six pages in the analysis results: Summary, Statistics&QC, Variants, Target gene large deletion, RAV and Report.
The Figure 5 depicts the Summary page. There are five major blocks of information:
- Sample info: The metadata information provided upon job initialization. This information can be edited using the edit button provided above. An example is depicted in Figure 10.
- Analysis report: The pipeline processing status is displayed. If a step fails or is still being processed, the report changes accordingly
- Analysis summary: This is the core information the user needs. The information can also be seen in the tabular view in the Analysis main page.
- Molecular drug susceptibility testing: The drug resistance of the sample is reported against the 15 selected drugs. Note that the resistance is only test for M. Tuberculosis samples. The samples are resistant against drugs colored red. In Figure 9, the sample is susceptible to BDQ, CFZ, DLM and LZD, and resistant to the other eleven drugs.
- Circos plot: The circos plot of the sample. The plot depicts the sequencing coverage of resistance-related genes in the sample. When a resistant associated variant is detected in the sample, the corresponding location is marked by a green bar, which get larger the deeper the depth in the position. Refer to the Circos page for more information on the plot structure.
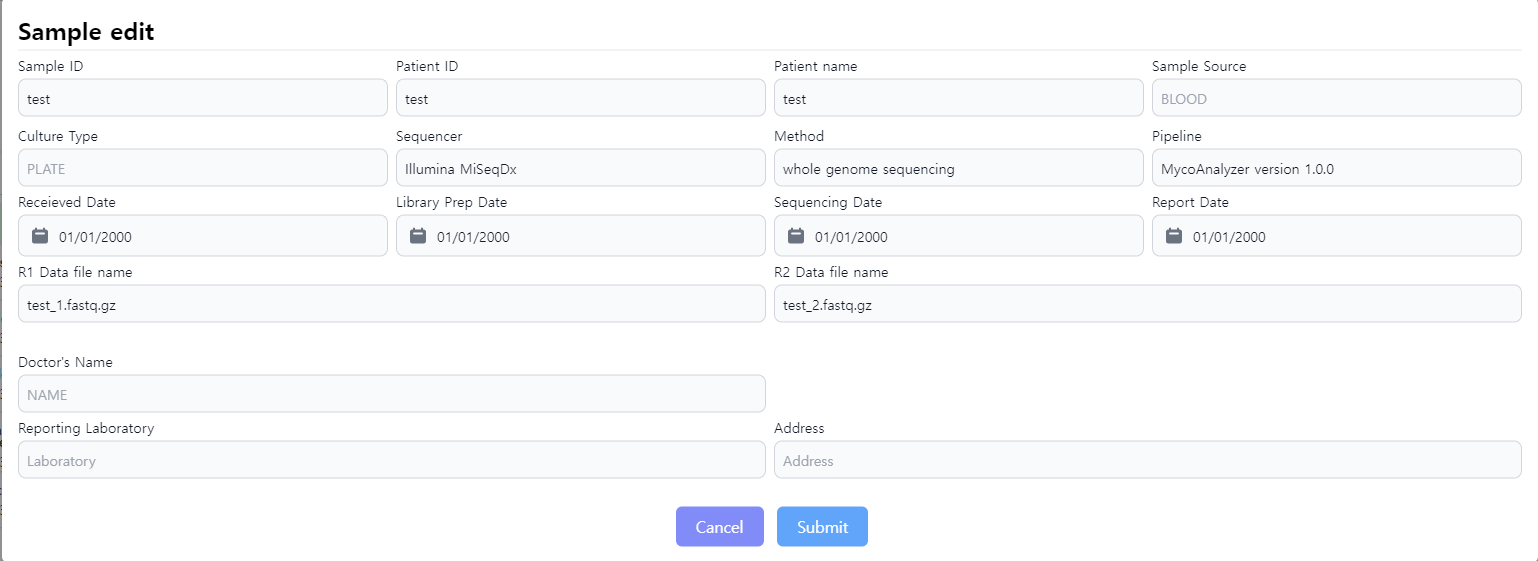
Figure 10: Editing the metadata of the analysis job. Extra information such as the Doctor's Name can be given additionally
Statistics and QC
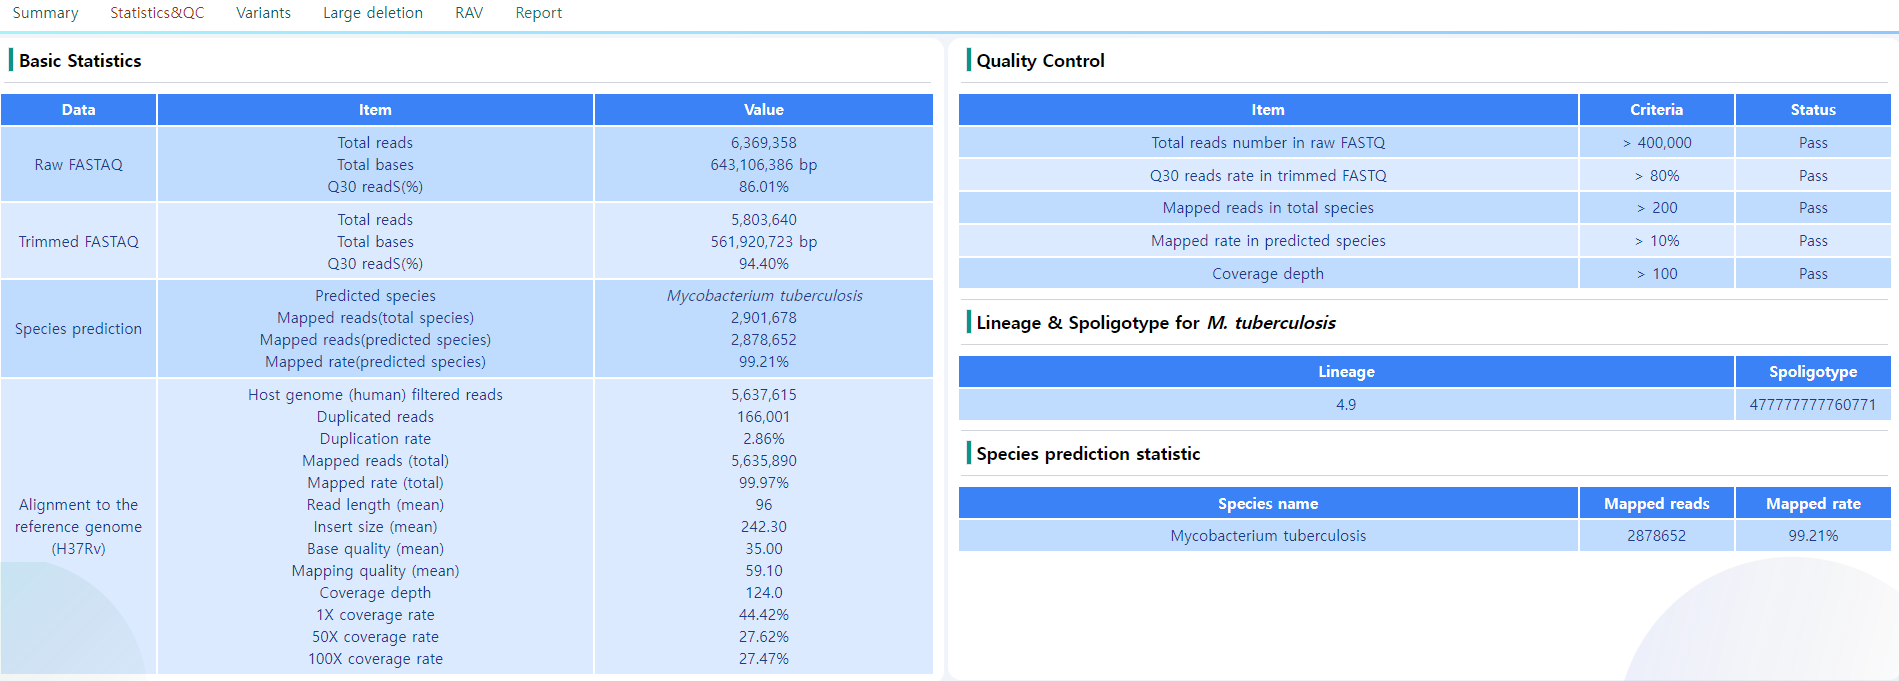
Figure 11: Statistics and QC page.
This page consists of four blocks, mostly on quality control and the primary identification of the sample strains. An example is depicted in Figure 11.
- Basic Statistics: General QC statistics and the similarity towards the H37Rv genome. The QC measures according the options chosen in the Analysis options can be seen.
- Quality Control: There are some measures for quality control specified to ensure the sample is a credible source of information. This section gives the user the information on the criteria of the QC passed. The QC criteria is chosen according to the values chosen in the Analysis options page.
- Lineage & Spoligotype for M. tuberculosis: Information on the Lineage and the Spoligotype as a measure to accurately identify mycobacterial species. Note that only M Tuberculosis samples are processed in this step. For the sample depicted in Figure 11, the sample is M. Tuberculosis, and the Lineage is 4.9 with the spoligotype 477777777760771.
- Species prediction statistics: The information on the determined species of the sample. The number of mapped reads and the mapped rate is also determined. In this sample, 99% of the mapped reads were mapped to M. Tuberculosis.
Note that some steps in the pipeline require fully passed QC measure. A sample with non-sufficient quality will not get a full result.
Variants
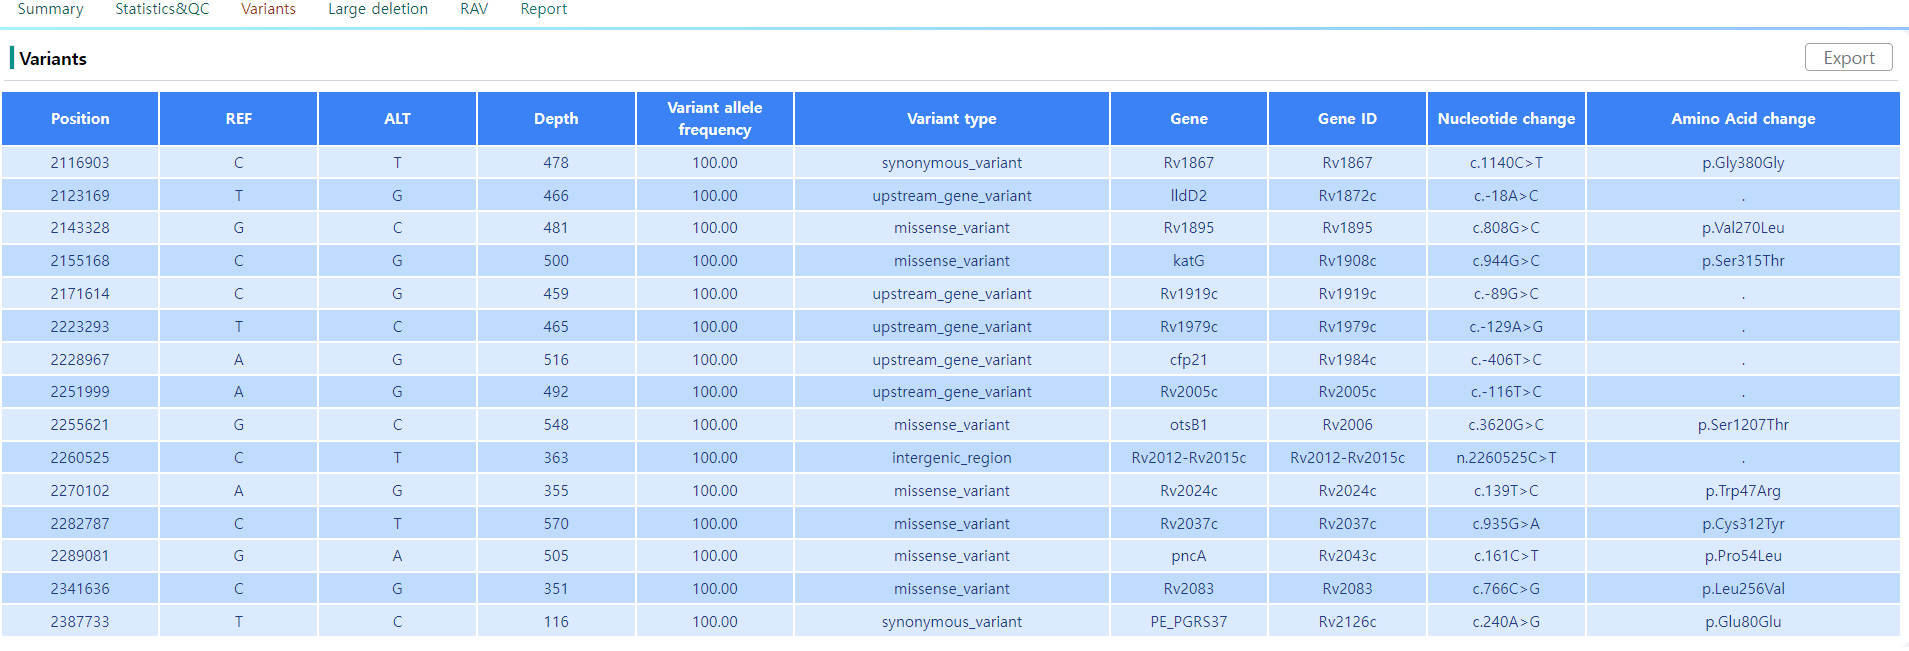
Figure 12: Variants page.
The variants page, as depicted in Figure 12, lists all the variants to the reference genome. In the tabular view, the position and the depth of the variant can be seen. The exact indel and mutation events and their positions are protocolled, as well as the coded gene and the impact on the transcribed sequence.
Note that the variant location can be visualized with the integrated IGV tool by clicking on the position column.
The tabular data can be downloaded by clicking on the Export button.
Large Deletion
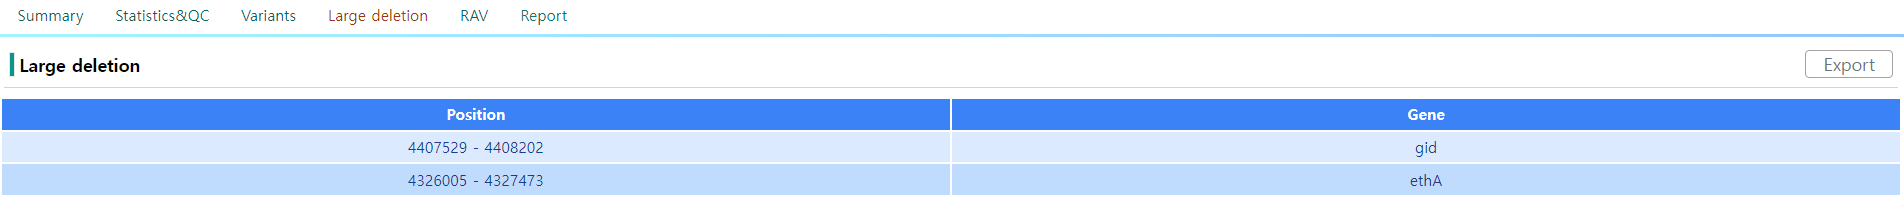
Figure 13: Large deletion page.
For four genes of interest, pncA, katG, gid and ethA, large deletion profile at gene level is estimated. These genes are known to be associated with drug resistance. The regions where at least consecutive 50 bps are sequenced with less than a certain threshold are protocolled. An example is depicted in Figure 13.
Note that the deletion location can be visualized with the integrated IGV tool by clicking on the position column.
The tabular data can be downloaded by clicking on the Export button.
RAV
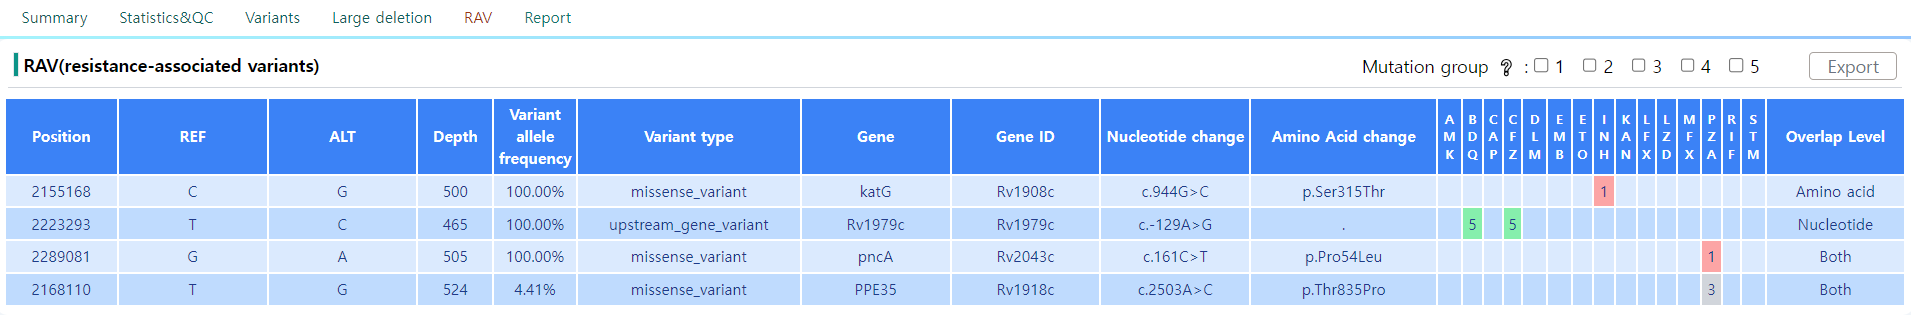
Figure 14: RAV page
The RAV stands for Resistance-associated genes and is a subset of the variant regions listed in the Variants page. The variants selected in this section are the variants that induce drug-specific resistance.
As depicted in Figure 14, the general structure of the tabular view is an extension of the table in the Variants page. Refer to Figure 12 for direct comparison. The table shows the resistence against the 15 drugs of interest. Generally, the value in the table has to exceed a certain threshold to be identified as resistant to a specific drug.
The numbering scheme follows the 2021 WHO catalogue of Mycobacterium tuberculosis complex, described in Walker et al. (2022). Use the following table for further analysis.
| Group | Description |
|---|---|
| 1 | Associated with resistence |
| 2 | Associated with resistance - interim |
| 3 | Uncertain significance |
| 4 | Not associated with resistance – interim |
| 5 | Not associated with resistance |
The following table can be used to interpret each column header.
| Drug | Name | Drug | Name |
|---|---|---|---|
| AMK | Amikacin | BDQ | Bedaquiline |
| CAP | Capreomycin | CFZ | Clofazimine |
| DLM | Delamanid | EMB | Ethambutol |
| ETO | Ethionamide | INH | Isoniazid |
| KAN | Kanamycin | LFX | Levofloxacin |
| LZD | Linezolid | MFX | Moxifloxacin |
| PZA | Pyrazinamide | RIF | Rifampicin |
| STM | Streptomycin |
Note that the variant location can be visualized with the integrated IGV tool by clicking on the position column.
The tabular data can be downloaded by clicking on the Export button.
Report
In the Report section, all analysis information can be viewed in the summarized format. The pdf version of the analysis can be downloaded by using the PDF Download button. The user can insert additional comments by using the Comment Edit button. Figure 15 depicts an example of a full report, and Figure 16 the edit section.
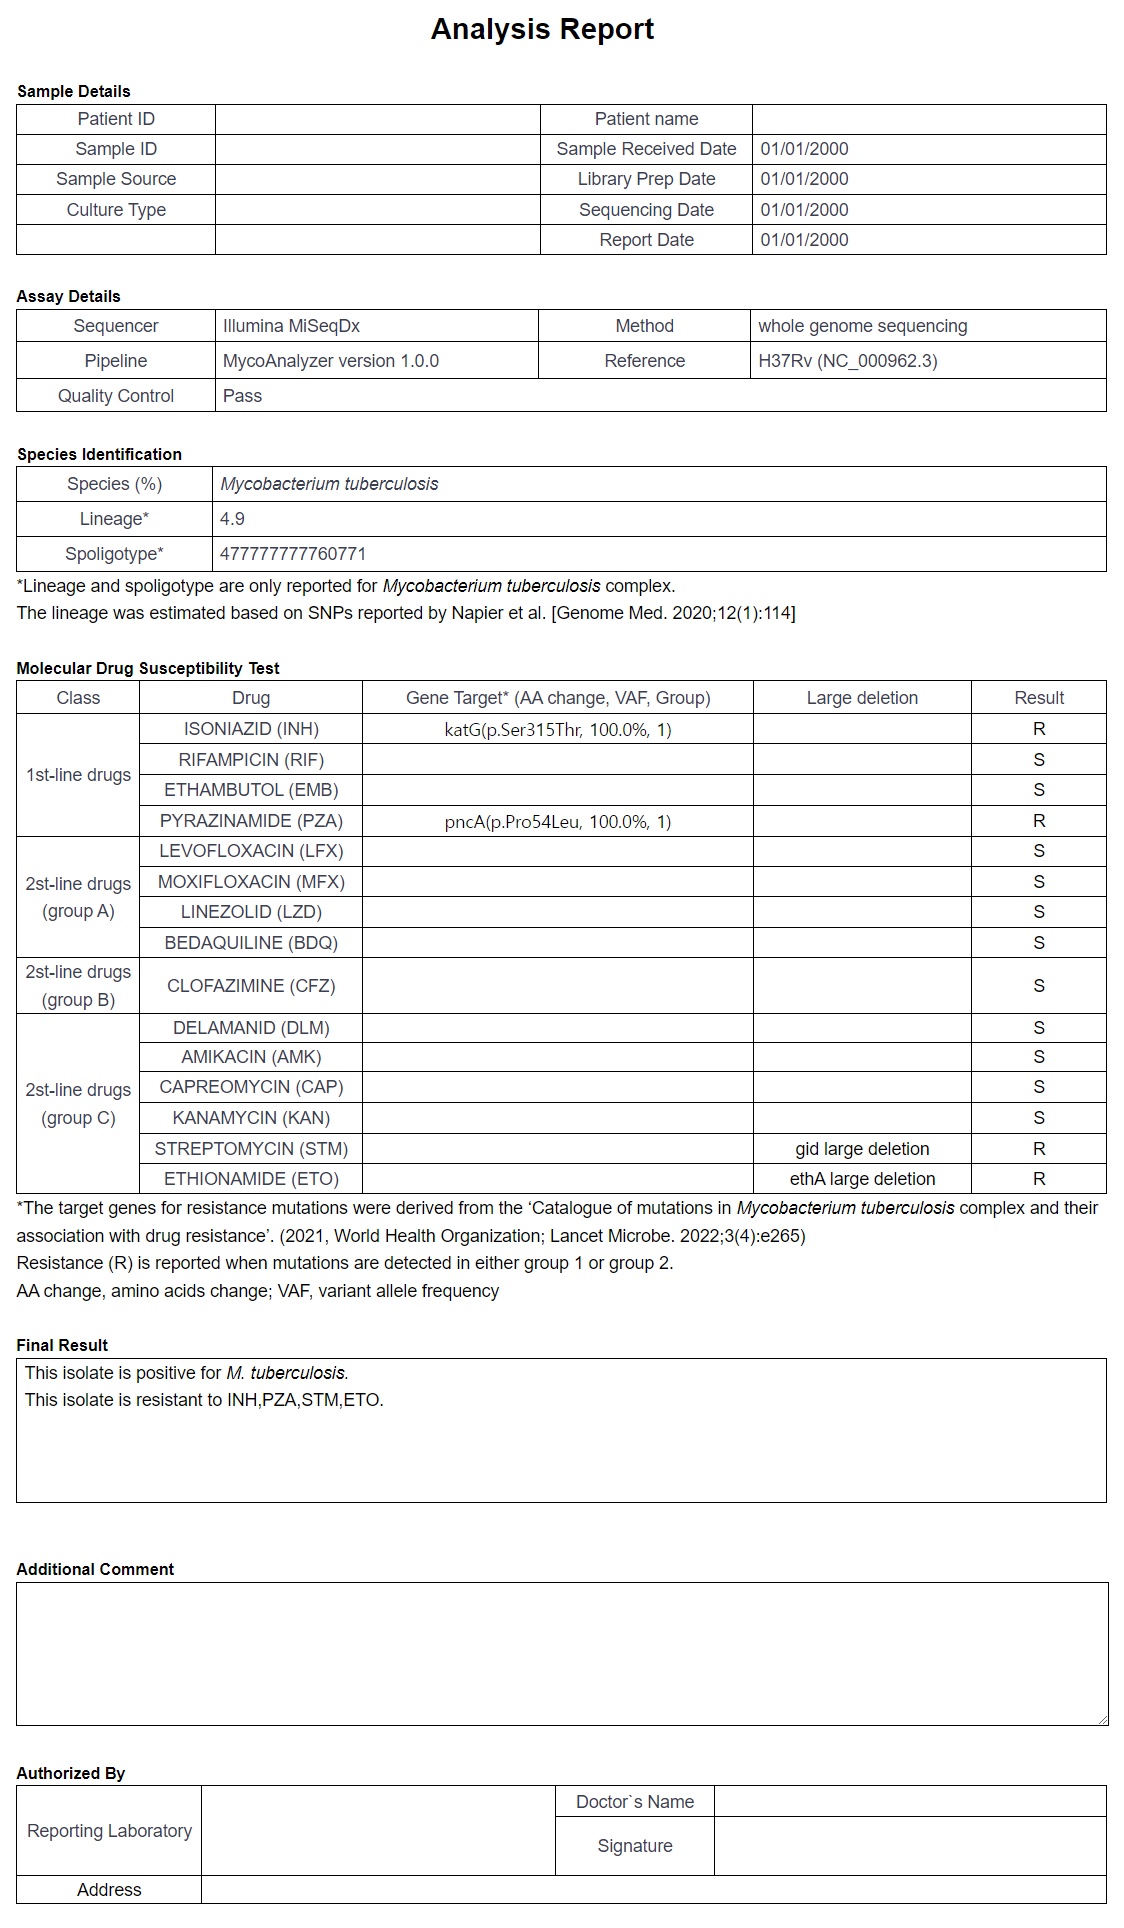
Figure 15: Full report view.

Figure 16: The comment edit section. The user can add extra comments in this block